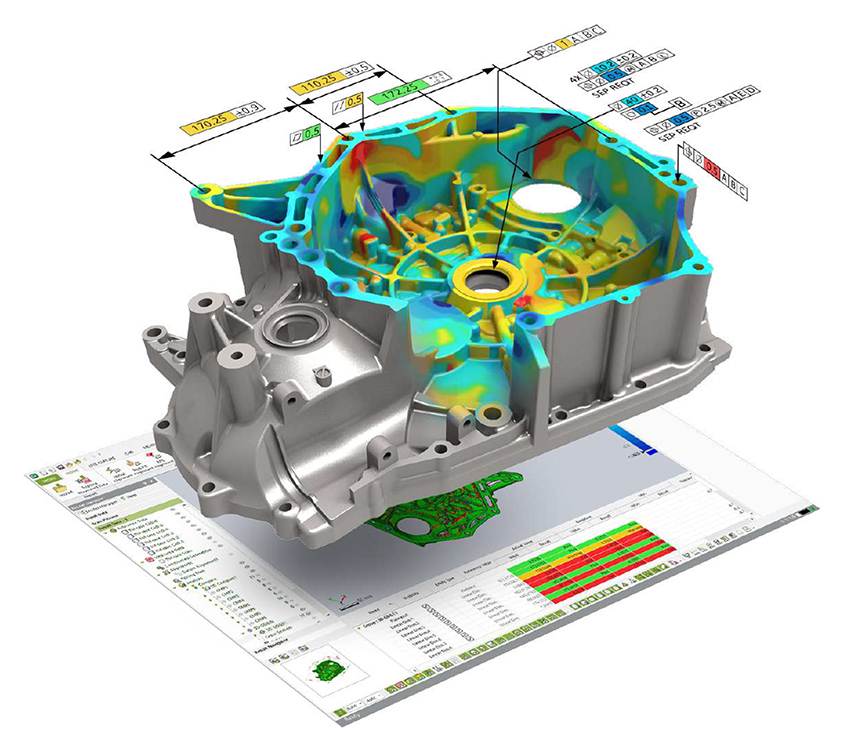
Geomagic Control X is professional metrology software that allows you to capture and process data from 3D scanners and other devices to measure, understand and communicate inspection results to ensure quality at every location. With Control X, more people in your organization can:
Measure data faster
measure more frequently
Measure more fully
Measure anytime, anywhere

Give you comprehensive quality assurance
Bring 3D scan-based inspection capabilities to more people, in more places, with software that easily captures and interprets scan data.
Get deeper insights beyond pass/fail
3D scanners capture far more information than hand tools or CMMs. Control X allows you to leverage this rich data to understand whether a part is within or outside tolerance.
Optimize manufacturing processes
With insights gained from comparing scanned parts to CAD models or master parts in Control X, those involved can identify and resolve issues faster than ever before.
7 times faster
Use Control X to 3D scan and inspect parts 7 times faster than using a coordinate measuring machine.
Cost reduction by 80%
Control X customers can reduce inspection costs in time and labor by nearly 80%.

Features
1. Scanning and hard testing
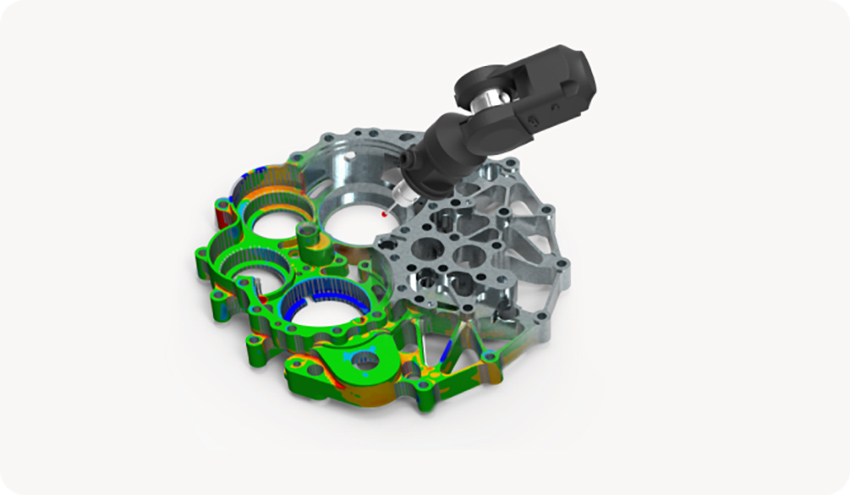
• Fully supports a variety of portable measurement devices, and collects point cloud data and polygon meshes from all mainstream 3D scanners, articulated arms, laser trackers, light pen optical CMMs and other devices through plug-ins
• Automatic patching and cleaning of point clouds and triangular patches, filling holes based on curvature, creating triangular patches, and CAD surface patching
• Built-in CAD original file import tool that supports CATIA, Autodesk Inventor, NX, SolidWorks and Creo (formerly Pro/ENGINEER). The PMI information (including dimensions and geometric tolerances) marked on the CAD model can be directly read into the import interface. Available free of charge.
• Built-in powerful contact hard probe detection function

2. Alignment
• Intelligent and automatic alignment based on feature recognition
• Choice of multiple alignments (datum, feature, reference point RPS, 3-2-1 or best fit)
• Save, load and apply alignment methods for automated and reproducible inspections
3. Compare
• Compare scanned data from production parts to CAD models, or to the average of several scanned models
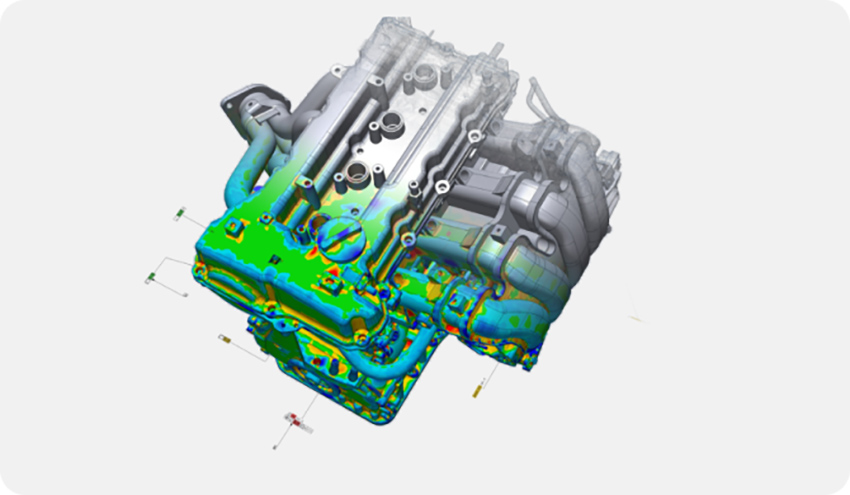
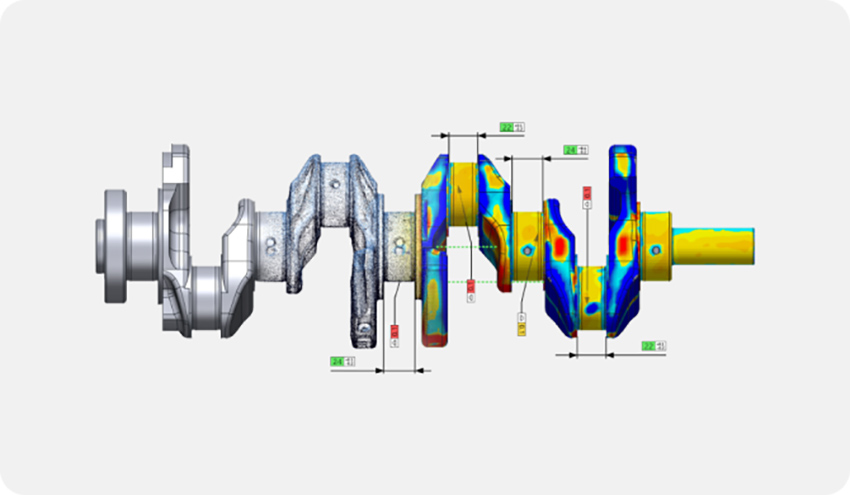
• Reflect the error situation of each part of the entire part by generating a three-dimensional color deviation map model
• Define and modify deviation chromatograms, including segmented deviation chromatograms
• Create pass/fail graphical reports for easy reading and analysis
• Generate whisker-shaped deviation diagrams for model cross-sections
• The comparison results of different alignment methods and different scanned data can be displayed side by side for easy comparison.
• Different surfaces can have different tolerances set according to requirements
4.Evaluation
• A variety of detection tools, such as overall deviation, section deviation, comparison point deviation, and curve deviation
• Advanced deviation tools such as boundary deviation, projected deviation, virtual edge deviation
• Analyze patch shape, such as thickness, curvature, angle; patch-to-patch detection (using patch data as reference data)
• Feature recognition, smart dimensions; mechanical dimensioning tools such as hole depth, hole diameter, counterbore
• Fully supports 3D ANSI/ASMEY 14.5 GD&T; fully supports 2D GD&T; standard display GD&T function control box
• Use planes, curves, and cylinders to perform various section operations, and easily complete rotational sections and step sections.
• Analytical displays such as color map, vector, color point, single part, above/below tolerance values
• Multiple ways to add annotations, such as selection, linear/circular/cylindrical/spherical array, along curves
• Tolerance labels; color bar templates; automatic retrieval and display of scan pairs; intelligent domain segmentation tools
• After marking 2D/3D dimensions and GD&T in CAD, actual measured values are automatically generated without additional operations.
5.Report
• Generate detailed inspection reports including inspection data, multiple views, comments and results
• Design and customize inspection reports with powerful yet simple report design tools, edit report layouts, and add elements by dragging and dropping
• Automatically generate inspection reports in HTML, PDF, Excel and PPT formats
• Export CSV and Unicode data for trend analysis and statistical process control (SPC)
